|
[20/03/2007] RESISTIVITY
MEASUREMENTS - GENERAL
The
ability of a material to conduct or resist the flow of
electrical current is an extremely useful property in evaluating
well formations. Most reservoir rocks consist of non-conductive
minerals. These matrix pore space, if any, will the filed with
non-conductive hydrocarbons and / or conductive formation water.
As a result, formation resistivity is related to the amount of
water or fluid in the formation pore space.
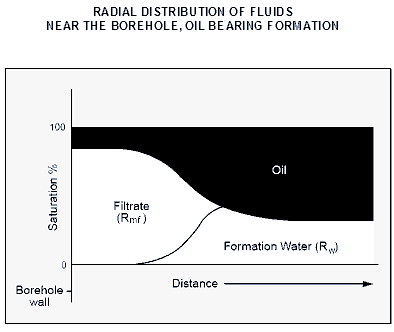
Unfortunately measurement of the true formation resistivity is
complex Resistivity measurements, which are taken from the
borehole, are affected by the invasion of drilling mud filtrate
into permeable formations. This invasion can be very shallow to
very deep. There for, it is necessary to use several resistivity
tool measurements, with different depths of investigation to
accurately determine the true resistivity of the formation. As a
result, most resistivity tools are designed to take several
resistivity measurements simultaneously.
By
measuring formation resistivity at several different depths of
investigation a correction may by made to the deepest
measurement to correct for the effect of mud filtrate invasion.
This corrected measurement is close to the actual resistivity of
the undisturbed formation resistivity. An estimate of the depth
invasion may also be obtained. The adjacent chart was
constructed to apply this principle to the resistivity
measurements obtained with the Dual Induction Laterolog (DIL)
instrument. Other charts are available to correct for invasion
effect with the Dual Laterolog MSFL instrument as used in
borehole containing a saline mud system.
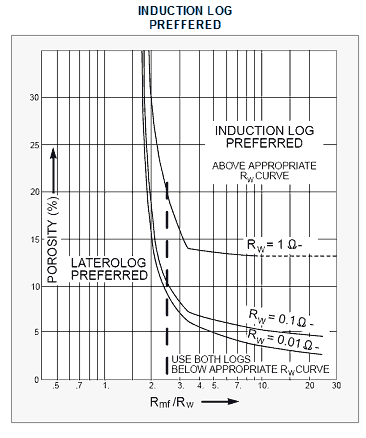
Dual induction tools are usually selected for low resistivities
and fresh mud while the Dual Laterolog is selected for high
resistivities and salt mud. When the ratio of mud filtrate
resistivity to formation water resistivity is 2.5 or greater,
the Induction tool is preferred. When this ratio is
approximately equal to 2.5, it may be necessary to use both the
Induction and Laterolog for proper evaluation.
Microresistivity devices are used to find resistivities in the
flushed zones near the borehole. In addition to many other uses,
this data can be used to correct invasion effects for Induction
and Laterolog tools.
Resistivity Logs - Resistance, Resistivity, Conductivity,
Resistivity (or electrical logs) logging is basically the concept where an
ohmmeter circuit measures the impedance to the flow of electrical current
though a material,
The resistance (r) will
depend upon the length (L), the cross sectional area (A), and the resistivity (R) of the
sample. Stated mathematically r = R L/A. Formation resistivity is a basic property of material,
just as the color, smell, density, and hardness are. Resistivity, can then be shown
as R = r A/L.
The resistivity
devices currently used by Century at this time are indicated
below:
Resistivity
|
DEVICE |
FEATURE |
RELATIVE DEPTH OF
INVESTIGATION |
ADVANTAGES &
DISADVANTAGES |
|
Micro |
Formation Dip |
Very
shallow - Rxo |
Good Resolution
difficult to
quantify |
|
Single
point |
Stratigraphy |
Very
shallow - Rxo |
Good
Resolution
difficult to quantify |
|
16"
Normal |
Stratigraphy |
Shallow - Rxo |
Quantified,
good resolution,
must correct
for hole
size and mud resistivity |
|
64"
Normal |
Porosity & Rt |
Moderately Deep - Rt |
Quantified, affected by invasion, poor resolution |
|
3
Electrode Guard |
Porosity |
Moderately Deep - Rxo/Rt |
Good Resolution
affected by bed boundaries |
|
Induction |
Porosity |
Focused Deep - Rt |
Good Resolution,
Little or no borehole effects, limited in high
resistivity formation |
|
Fluid
Resistivity |
Mud
Resistivity |
No
Formation Characteristics Rm Only |
Measure
resistivity of mud correction of other res. logs |
Rxo =
Resistivity of the flushed zone
Rt = Resistivity
of uninvaded zone
Rm = Resistivity
of Mud
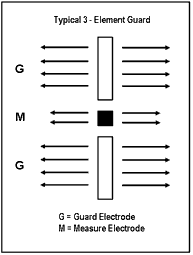
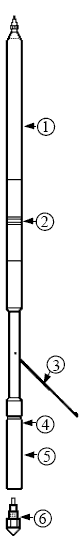
Guard Resistivity
The Guard
Resistivity logs are another type of resistivity device. A small
measure electrode, with large
guarding electrodes above and below the measure
electrode, focus the current
path into the formation (Figure 6). The guard electrodes and
measure electrode are all maintained at the same electrical
potential. The tool circuitry compares the measure electrode
current with that of the guard electrodes current which
is adjusted to maintain this equal potential.
Guard
Resistivity System
In this method, the signal of the measure
current is
maintained at a precise magnitude. The
voltage at the measure
electrode varies in response to the changing lithology as
described below:
Em
=
KiRg
Where,
Em = signal voltage at the measurement electrode.
Ki = the tool coefficient as determined by
geometrical factors and excitation current
Im in
Amps/Meter
Rg = the
apparent formation resistivity in ohmmeters measured by the
guard system
The system therefore measures Em, which is in a direct
proportion to the
measured
parameter Rg. The guard resistivity has some distinct
advantages over other resistivity devices. Number 1, is the
focusing of the beam which allows for thinner
beds to be recognized and
evaluated. Number 2, bed boundaries are sharper and more
defined, but in some cases, the thickness of the formation using
the guard log results in a smaller thickness than the
actual formation.
Our resistivity
tools base on this concept. Deep Guard Resistivity and Short
Guard Resistivity placed in different tool. Deep Guard
Resistivity placed in combination with CNT 9073 tool, Short
Guard Resistivity placed in combination with CDT 9039 tool.
DEEP GUARD
RESISTIVITY (DG)
CNT 9073 with
Deep Guard Resistivity
Specifications
|
Dimension |
|
|
|
Tool Length |
283.5 cm |
111.6 in |
|
Diameter |
5.08 cm
|
2.0 in |
|
Weight |
25 kg
|
55 lb |
Offset Parameter
|
Sensor # |
Tipe of
Sensor |
Offset |
|
1 |
Gamma Ray |
30.5 cm
|
12 in |
|
2 |
Deep Guard |
152.4 cm
|
60 in |
|
3 |
Far Neutron |
209.8 cm
|
82.6 in |
|
4 |
Near Neutron |
246.4 cm
|
97 in |
Operation Parameter
|
Parameter |
|
|
|
Max
Temperature |
85 C
|
185 F |
|
Max Pressure |
232 kg/cc
|
3300 PSI |
|
Logging Speed |
9 m/min |
30 ft./min |
|
Tool Voltage |
70 VDC |
|
|
Radioactive
Usage (6) |
5 Ci |
AmBe241 |
|
RA handling tool |
Source handling tool |
|
Calibrator |
Water Tank |
85 API GR
blanket |
| |
Mixture Resistivity Box |
CDT 9039 with Short Guard
Resistivity
Specifications
|
Dimension |
|
|
|
Tool Length |
280.3 cm
|
110.35 in |
|
Diameter |
56 mm
|
2.2 in |
|
Weight |
29.5 kg
|
65 lbs |
Offset Parameter
|
Sensor # |
Tipe of
Sensor |
Offset |
|
1 |
Gamma Ray |
21 cm |
8.25 in |
|
2 |
Short Guard |
63.5 cm
|
25 in |
|
3 |
Caliper |
210.8 cm
|
83 in |
|
4 |
Far Density |
243.3 cm
|
95.8 in |
|
5 |
Near Density |
259.3 cm
|
102.1 in |
Operation Parameter
|
Parameter |
|
|
|
Max
Temperature |
74 C |
158 F |
|
Max Pressure |
175 kg/cm2
|
2500 PSI |
|
Logging Speed |
9 m/min |
30 ft./min |
|
Tool Voltage |
56 VDC |
|
|
Radioactive
Usage (6) |
1 Ci |
Cs 137 |
|
RA handling tool |
Source handling tool |
|
Calibrator |
Water Tank |
85 API GR
blanket |
| |
Mixture Resistivity Box |
SPONTANEOUS POTENTIAL LOG (SP)
The SP records
naturally occurring electrical potentials in the borehole. The
SP is usually run in combination with other tools in an
open-hole where the salinity of the drilling fluid differs from
that of water in the formation.
Measurements of
the small “millivolt” potential between the electrode on the
sonde and a surface electrode generally show two useful
characteristics – a straight line opposite impermeable strata
when the salinity of the formation water is greater that the
salinity of the drilling fluid. These variations give
qualitative information concerning permeability, but not
quantitative information since there is no definite correlation
between the amplitude of the curve and the degree of porosity or
permeability of the formation.
The principle
uses of the SP curve are:
·
To
determine a value for formation water resistivity (Rw).
·
To
correlate formations from well to well or log to log.
·
To
locate bed boundaries.
·
To
indicate permeable beds.
|